Taking a practical approach to BigQuery cost monitoring
Google BigQuery is a serverless enterprise data warehouse tool that’s designed for scalability. We built BigQuery to be highly scalable and let you focus on data analysis without having to take care of the underlying infrastructure. We know BigQuery users like its capability to query petabyte-scale datasets without the need to provision anything. You just upload the data and start playing with it.
BigQuery comes with two different pricing models:
- The on-demand model, where users are charged for the amount of TB of data to be processed by their queries;
- The flat model, suitable for customers who want to pay a monthly fixed cost to be able to execute unlimited queries, regardless of the amount of processed data.
When our users choose the on-demand option, we often get one question: How can I monitor the spending of my users? Here, we’ll show you how to implement a fully serverless solution for near–real-time cost monitoring using readily available log data.
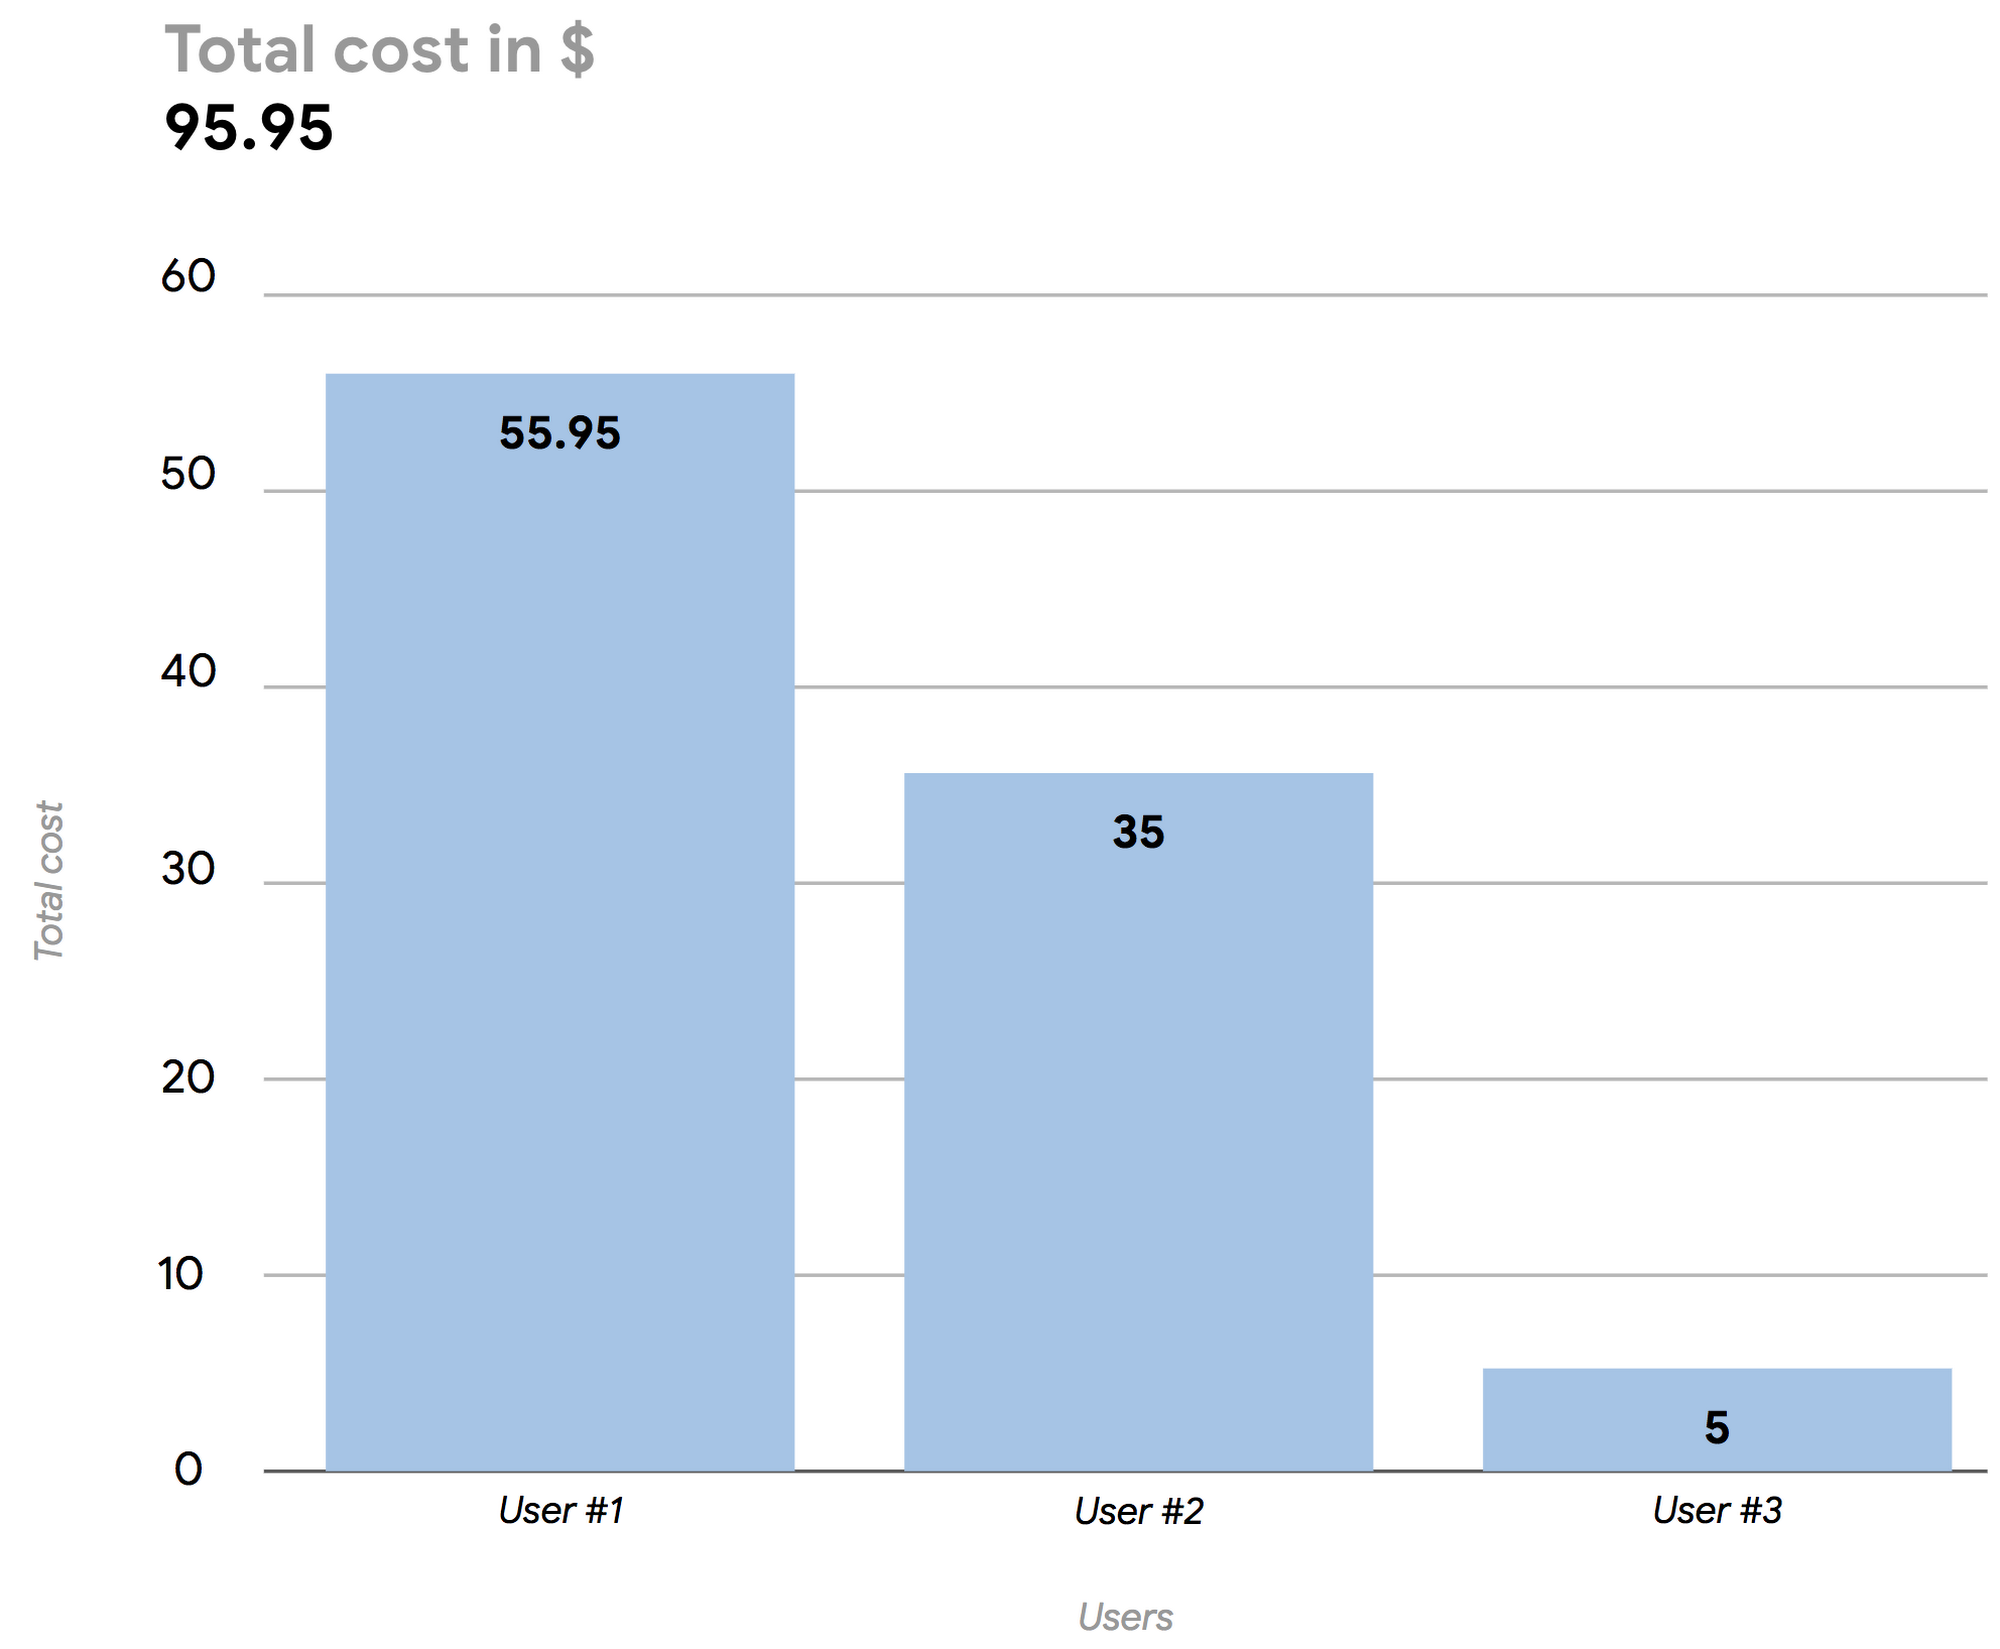
To achieve this, we’ll build a Data Studio dashboard (easily integrated into BigQuery) to report the daily BigQuery spending split by users at a particular organization. In this example, the daily cost to the organization was $95.95, with three users contributing to that total.
Here’s how to build your own dashboard to monitor BigQuery usage costs.
Collect the necessary log data
All the information you need to build the cost monitoring dashboard is available through the Cloud Audit Log service in Google Cloud Platform (GCP), which keeps track of all the events generated by BigQuery, such as the creation of a table, a data insertion or a query execution. The system will log all the operations, and you can then see the entries in GCP’s Stackdriver logging and monitoring tool. Here’s an example of a list of BigQuery events shown in Stackdriver:
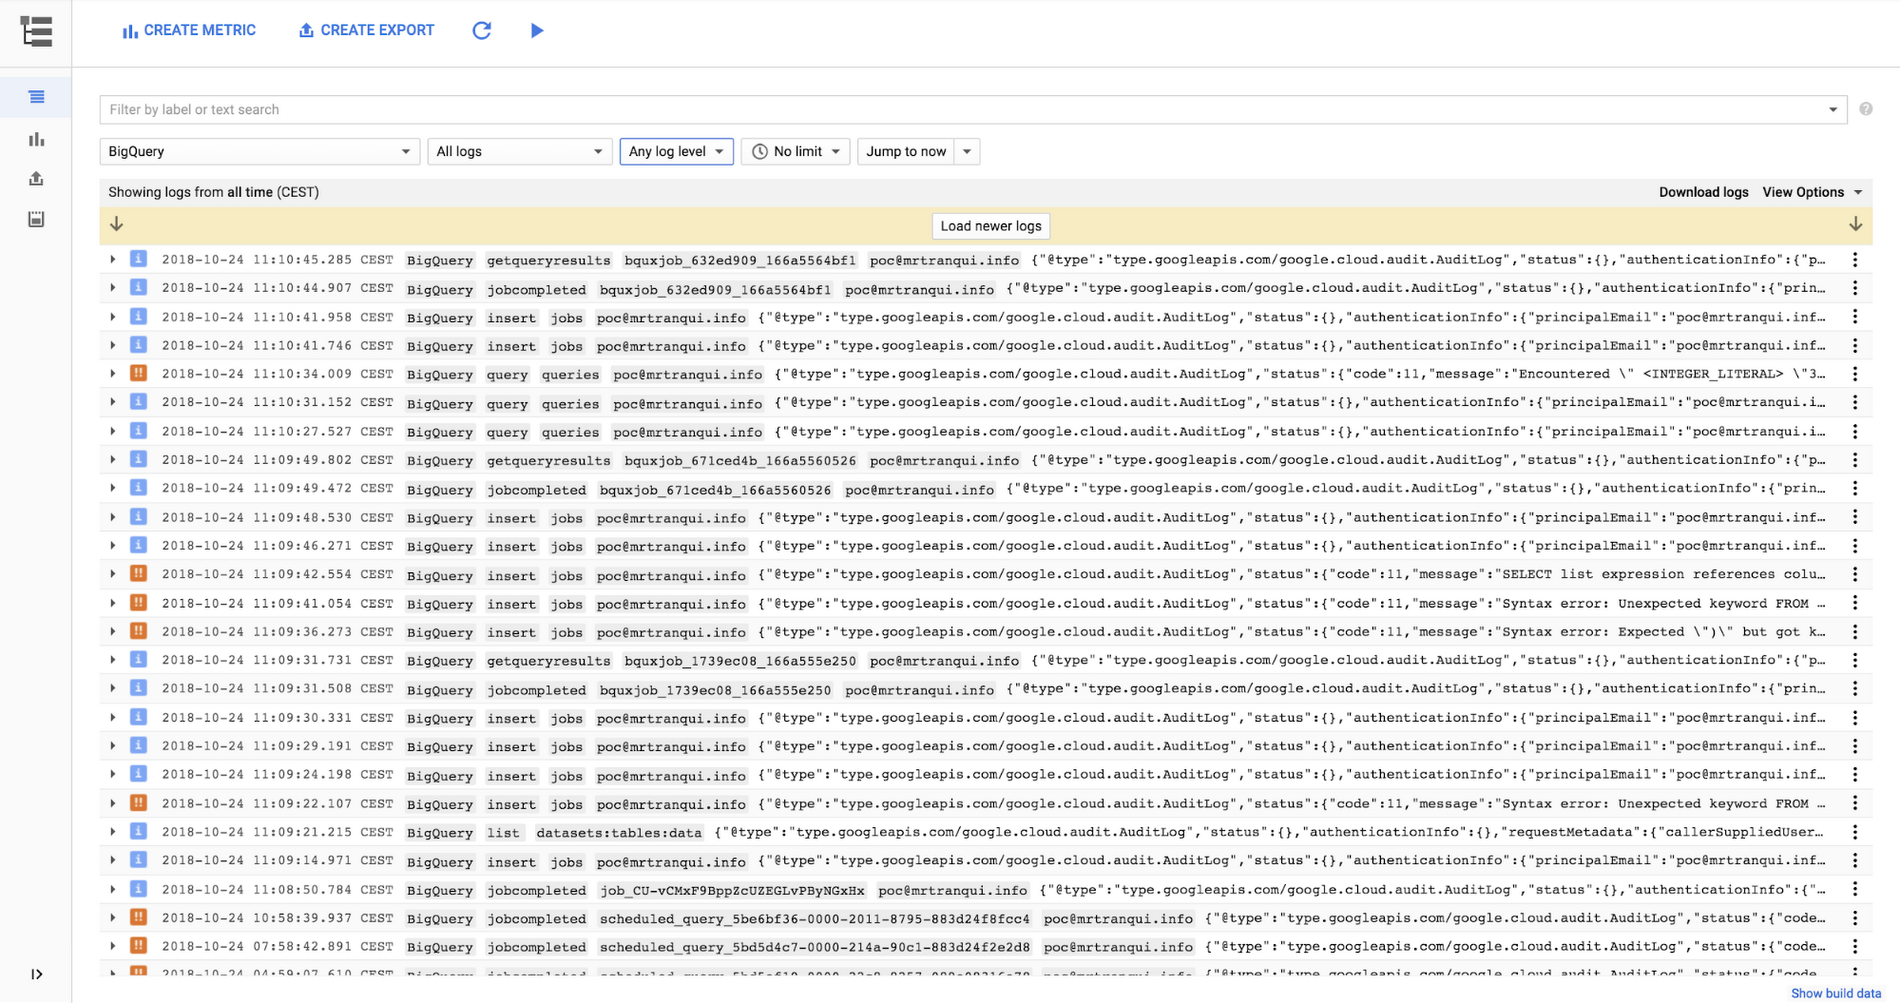
To build a cost monitoring dashboard, you’ll need the information tied to the events tagged “query_job_completed.” If you select one of those events and expand it, you’ll see several details about the query that was executed, like the SQL code, the job ID and, most important, the user who executed the query and the amount of data that was processed. With that information, you can compute the total cost of the query using a simple multiplication equation: cost per TB processed * numbers of TB processed.
Move log data into BigQuery tables
Once you’ve identified your data, the fastest way to generate a dashboard using Data Studio is to input all the information into (guess where?) BigQuery. To do that, use the sink feature of Stackdriver to activate a streaming pipeline to ingest logs into BigQuery, in close to real time. You’ll need to define the subset of information that’s needed (in this case, all the BigQuery “query_job_completed” events) and create a sink that has BigQuery as the target. Data will automatically flow into daily BigQuery tables as soon as it is collected by the Cloud Audit Log service.
Note that you can export logs of all the projects within your organization by using the aggregated exports feature. However, you’ll need to have appropriate IAM access.
Create a targeted view
Once the raw data is available in BigQuery, create a dedicated view that contains only the information needed to generate the dashboard:
- The name of the user who executed the query
- The cost of the query
Once you have that information, use the following query to generate a BigQuery view that computes daily user spending based on the raw data collected from Stackdriver.
SELECT
	protopayload_auditlog.authenticationInfo.principalEmail as user,
	5*
		(protopayload_auditlog.servicedata_v1_bigquery
			.jobCompletedEvent.job.jobStatistics.
				totalProcessedBytes/POWER(2,40)
		) as queryCostInUSD
FROM `<project-id>.<data-set>.cloudaudit_googleapis_com_data_access_*`
WHERE protopayload_auditlog.servicedata_v1_bigquery
		.jobCompletedEvent.eventName="query_job_completed"
AND
	_TABLE_SUFFIX = (
  		SELECT REPLACE(CAST(CURRENT_DATE() AS STRING),"-","")
	  	FROM `<project-id>.<data-set>.__TABLES_SUMMARY__`
		LIMIT 1
	)
AND
	protopayload_auditlog.servicedata_v1_bigquery
			.jobCompletedEvent.job.jobStatistics.totalProcessedBytes
				IS NOT NULL
Note that the above SQL code will automatically select the data for the current day. Also note that this query uses the current on-demand pricing for the EU and U.S. to compute the total cost of a query; pricing could vary for other regions. Returned data is related to list pricing and does not reflect any eventual discounts or credits that can be applied at the billing account level. For details about overall GCP billing, you can export the data to BigQuery using the native export function.
Build a Data Studio dashboard
Now that you’ve defined your BigQuery view with the necessary data, it is simple to use Data Studio to create a dashboard that sums up all the costs and groups them by user. You’ll end up with a dashboard that can be shared with anyone who wants to monitor daily BigQuery on-demand spending.
That’s one small subset of the information BigQuery makes available. We encourage you to dig into your BigQuery data to find other elements that could be interesting for you and your business (a small hint: try cached queries ).
Source: Taking a practical approach to BigQuery cost monitoring
Transforming Enterprises with
Data & AI Services & Solutions.
ThirdEye delivers Data and AI services & solutions for enterprises worldwide by
leveraging state-of-the-art Data & AI technologies.