How to deliver on Machine Learning projects
A guide to the ML Engineering Loop

Follow the loop all the way up!
This post was co-authored by Emmanuel Ameisen, Head of AI at Insight Data Science and Adam Coates, Operating Partner at Khosla Ventures.
Want to learn applied Artificial Intelligence from top professionals in Silicon Valley or New York? Learn more about the Artificial Intelligenceprogram.
Are you a company working in AI and would like to get involved in the Insight AI Fellows Program? Feel free to get in touch.
As Machine Learning (ML) is becoming an important part of every industry, the demand for Machine Learning Engineers (MLE) has grown dramatically. MLEs combine machine learning skills with software engineering knowhow to find high-performing models for a given application and handle the implementation challenges that come up — from building out training infrastructure to preparing models for deployment. New online resources have sprouted in parallel to train engineers to build ML models and solve the various software challenges encountered. However, one of the most common hurdles with new ML teams is maintaining the same level of forward progress that engineers are accustomed to with traditional software engineering.
The most pressing reason for this challenge is that the process of developing new ML models is highly uncertain at the outset. After all, it is difficult to know how well a model will perform by the end of a given training run, let alone what performance could be achieved with extensive tuning or different modeling assumptions.
Many types of professionals face similar situations: software and business developers, startups looking for product-market fit, or pilots maneuvering with limited information. Each of these professions has adapted a common framework to help their teams work productively through the uncertainty: agile/scrum for software development, “lean” startups, and the US Air Force’s OODA loop. MLEs can follow a similar framework to cope with uncertainty and deliver great products quickly.
The ML Engineering Loop
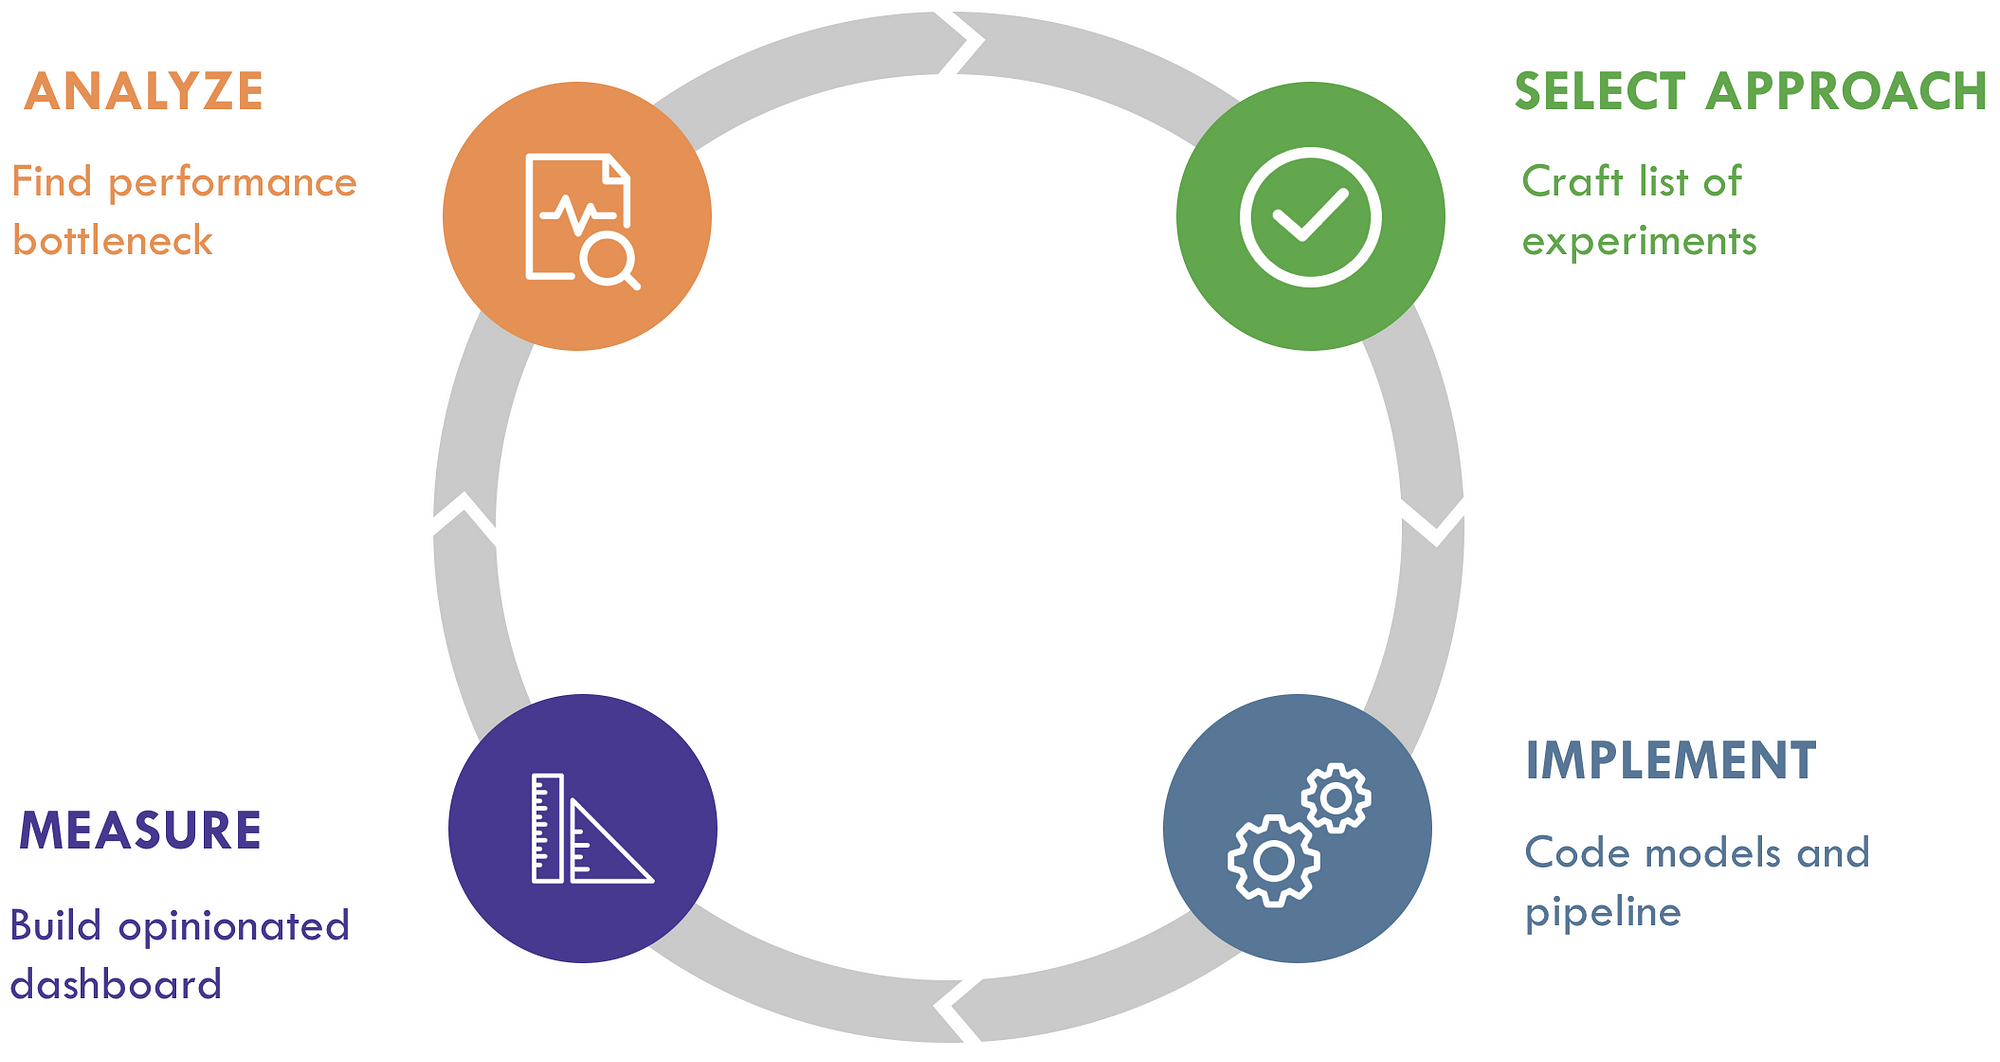
In this article, we’ll describe our conception of the “OODA Loop” of ML: the ML Engineering Loop, where ML Engineers iteratively
- Analyze
- Select an approach
- Implement
- Measure
to rapidly and efficiently discover the best models and adapt to the unknown. In addition, we will give concrete tips for each of these phases, as well as to optimize the process as a whole.
Success for an ML team often means delivering a highly performing model within given constraints — for example, one that achieves high prediction accuracy, while subject to constraints on memory usage, inference time, and fairness. Performance is defined by whichever metric is most relevant to the success of your end product, whether that be accuracy, speed, diversity of outputs, etc. For simplicity, we’ve elected to minimize “error rate” as our performance metric below.
When you are just starting to scope out a new project, you should accurately define success criteria, which you will then translate to model metrics. In product terms, what level of performance would a service need to be useful? For example, if we are recommending 5 articles to individual users on a news platform, how many of them do we need to be relevant, and how will we define relevance? Given this performance criterion and the data you have, what would be the simplest model you could build?
In product terms, what level of performance would a service need to be useful?
The purpose of the ML Engineering Loop is to put a rote mental framework around the development process, simplifying the decision making process to focus exclusively on the most important next steps. As practitioners progress in experience, the process becomes second nature and growing expertise enables rapid shifts between analysis and implementation without hesitation. That said, this framework is still immensely valuable for even the most experienced engineers when uncertainty increases — for example, when a model unexpectedly fails to meet requirements, when the teams’ goals are suddenly altered (e.g., the test set is changed to reflect changes in product needs), or as team progress stalls just short of the goal.
Getting started
To bootstrap the loop described below, you should start with a minimal implementation that has very little uncertainty involved. Usually we want to “get a number” as quickly as possible — — to build up enough of the system so that we can evaluate its performance and begin iterating. This typically means:
- Setting up training, development and testing datasets, and
- Getting a simple model working.
For instance, if we’re building a tree detector to survey tree populations in an area, we might use an off-the-shelf training set from a similar Kaggle competition, and a hand-collected set of photos from the target area for development and test sets. We could then run logistic regression on the raw pixels, or run a pre-trained network (like ResNet) on the training images. The goal here is not to solve the project in one go, but to start our iteration cycle. Below are a few tips to help you do that.
Tips
On a good test set:
- Since the team is aiming to perform well on the test set, the test set is effectively a description of the team’s goal. Therefore, the test set should reflect the needs of the product or business. For example if you are building an app to detect skin conditions from selfies, feel free to train on any set of images, but make sure that your test set contains images that are as poorly lit and of poor quality as some selfies can be.
- Changing the test set alters the team’s goal, so it is helpful to fix the test set early and modify it only to reflect changes in project, product or business goals.
- Aim to make the test and development sets large enough that your performance metric will be accurate enough to make good distinctions between models. If the sets are too small, you will end up making decisions based on noisy results.
- Similarly, you should try to curate any labels or annotations as much as practical for the development and test sets. A mislabeled test set is about the same as an incorrectly specified product requirement.
- It’s helpful to know how well humans perform on the test set, or how well existing / competing systems perform. These give you a bound on the optimal error rate, the best possible performance you could achieve.
- Reaching parity with human test performance is often a good long-term goal for many tasks. In any event, the ultimate goal is to bring test performance as close to our guess for optimal performance as possible.
Regarding the development and training set:
- The development set is the team’s proxy for test performance that they can use to tune hyper-parameters. As a result, it should be from the same distribution as the test set, but ideally from a disjoint group of users/inputs to avoid data leakage. A good way to ensure this is to first curate a large pool of samples, then shuffle and split them into development and test sets afterward.
- If you imagine that production data will be noisy, however, make sure that you account for that noise in your training set, by using data augmentation or degradation. You cannot expect a model trained exclusively on sharp images to generalize to blurry ones.
Once you have an initial prototype, you should check its performance on the training, development and test sets. This marks the end of your first (degenerate) trip around the loop. Take stock of the gap between the test performance and the performance required for a useful product. Now it’s time to start iterating!
Analyze
Identify the performance bottleneck
The analysis phase is like medical diagnosis: you’re equipped with a set of diagnostics that you can perform and your goal is to come up with the most likely diagnosis for what limits the performance of your model. In practice, there might be many different overlapping issues responsible for the current results, but your objective is to find the most glaring issues first so that you can resolve them quickly. Don’t get bogged down trying to develop a complete understanding of every shortcoming — — aim instead to understand the biggest factors since many of the smaller issues will change or even disappear as you make improvements to your model.
Below, we list a common set of diagnostics that you will use frequently along with some of the diagnoses. There is at least some art to selecting which diagnostics to run, but as you work your way around the ML Engineering Loop, you will gradually gain intuition for what to try.
A good starting point for every analysis is to look at your training, development, and test performance. We suggest putting code to do this at the end of every experiment to habituate yourself to looking at these numbers every time. On average, we will have: training error <= development set error <= test set error (if the data in each set follows the same distribution). Using the training, development and test error rates from your last experiment, you can quickly see which of these factors is currently a binding constraint. For example, when there is a small gap between training error and development set error then your training error represents the bottleneck to improved performance.
Diagnostics & diagnoses
If training set error is the current limiting factor, the following issues might be contributing:
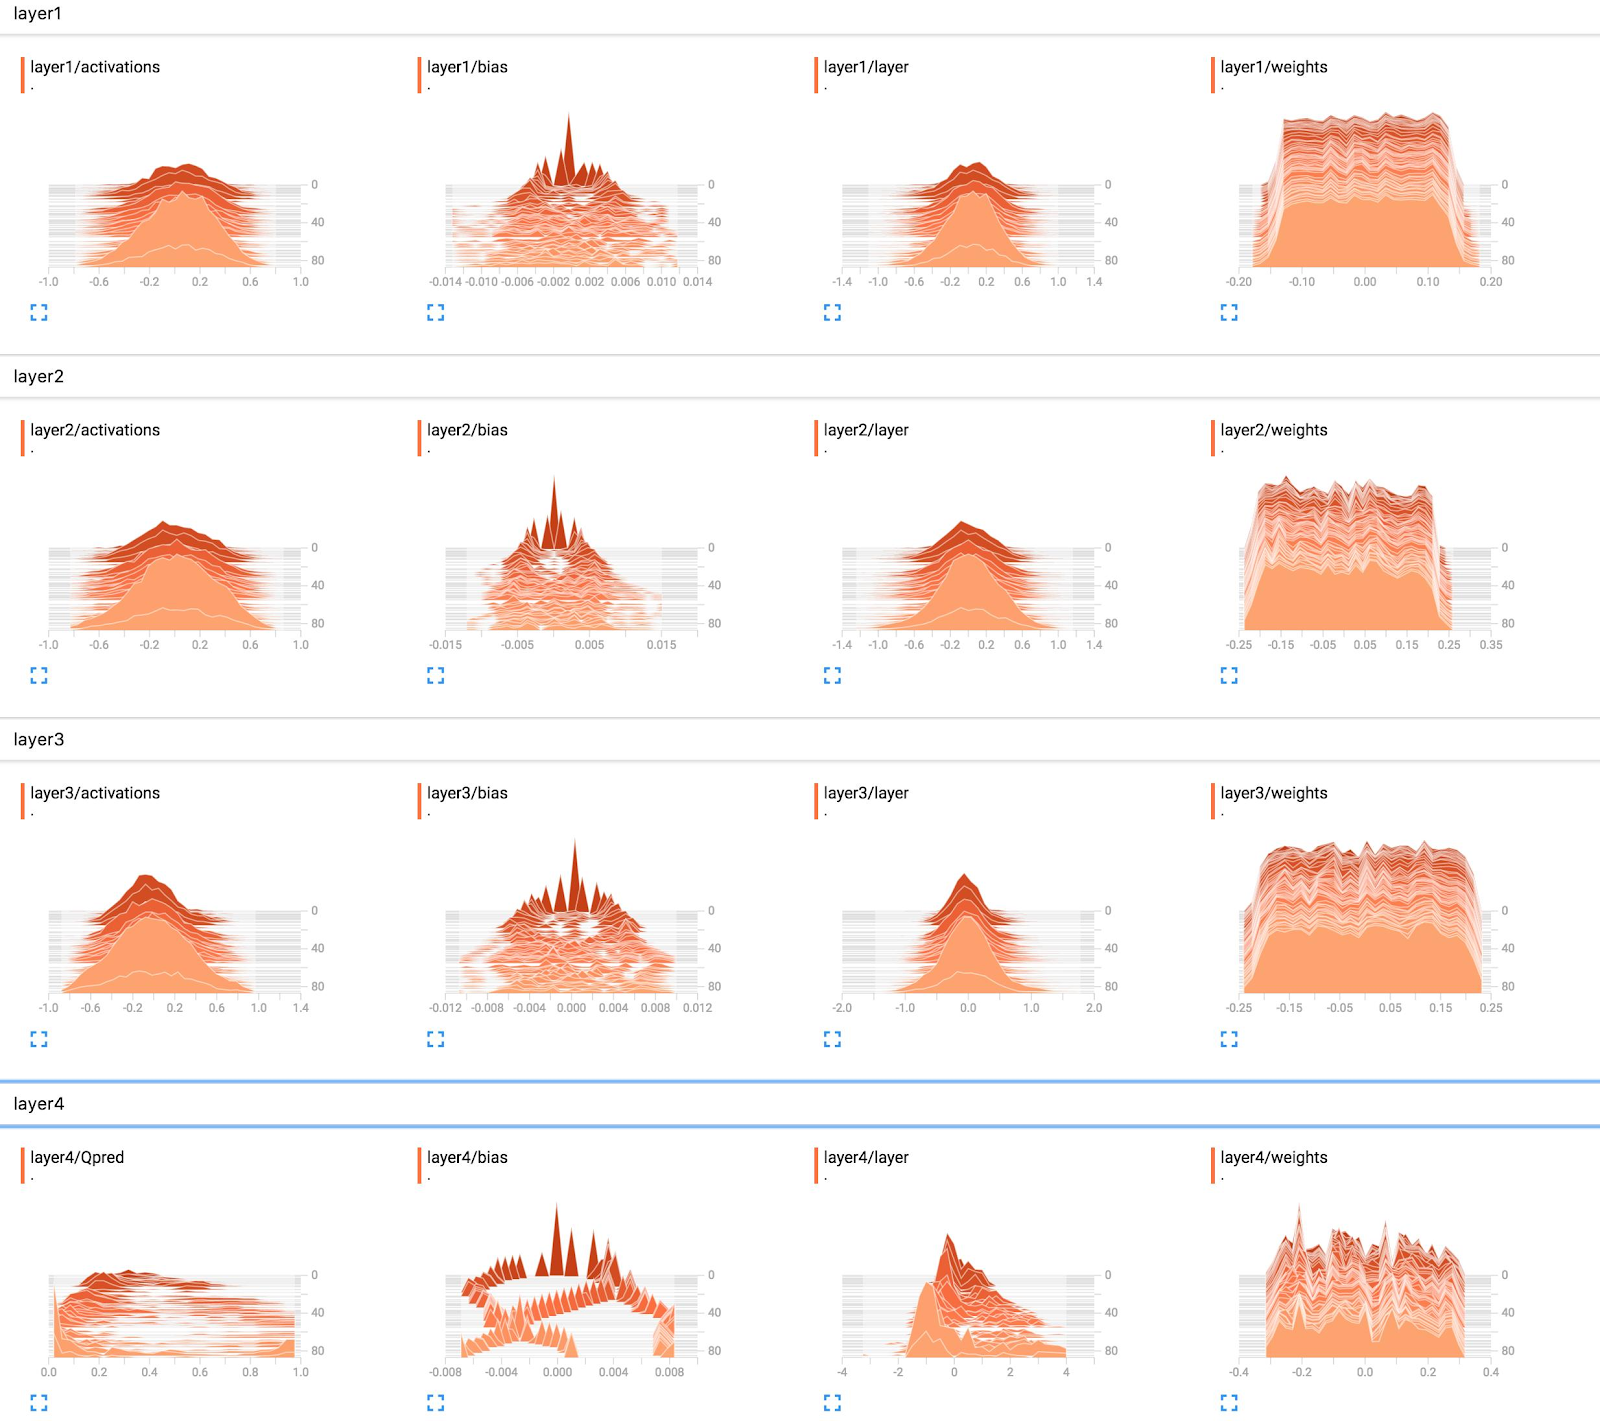
- The optimization algorithm (e.g., gradient descent for a deep neural network) is not precisely tuned. Look at the learning curve to see whether the loss is decreasing. Check whether you are able to overfit a much smaller dataset (e.g., by checking whether the loss decreases when training on a single minibatch or a single example). You can visualize histograms of neuron responses to check whether they are saturating (which might lead to gradient vanishing).
- The training set may have mislabeled or corrupt data. Manually inspect some training examples at the stage of your code just before they are consumed by the training algorithm.
- The model may be too small or inexpressive. For example, if you are using linear regression for a problem that is highly nonlinear, your model is simply incapable of fitting the data well. We say that the model is high biasor underfitting.
If development set error is the current limiting factor, this may be caused by an analogous set of issues as above:
- The model may be too large or expressive, or insufficiently regularized. We say that the model has high variance or is overfitting.
- There is insufficient training data to learn a good model of the underlying pattern.
- The distribution of the training data doesn’t match the development or test data distribution.
- The hyper-parameters for the model are set poorly. If you’re searching over hyper-parameters (such as feature sets, regularization terms, etc.) it could be that the search method isn’t finding good choices.
- The “inductive prior” encoded in your model is a poor match to the data. For example, if you are using a nearest-neighbors method when the data is naturally represented by a linear function, you might generalize poorly unless you have a lot more training data.
If test set error is the current limiting factor, this is often due to the development set being too small or the team overfitting to the development set over the course of many experiments.
For any of the above situations, you can understand the failures of your models by manually inspecting a random set of examples your model gets wrong (You should generally not do this for the test set to avoid “training” your system on those examples.).
- Try to identify common types of errors by visualizing the data. Then go through the examples and keep a tally for how often each type of error occurs. For classification, look at a confusion matrix and identify the classes you perform the worst on. You can then focus on resolving the types of errors that account for the most mistakes.
- Some examples may be mislabeled or have multiple reasonable labels.
- Some examples may be more difficult than others, or may be missing context needed for a good decision. Tagging some examples as “very hard” might help you direct your efforts to lower hanging fruit if several groups of errors are equally common. Similarly, tagging some as “very easy” might tip you off to a trivial mistake in your system that’s causing it to miss out on easy cases. This is a bit like estimating the “optimal error rate” on different subsets of the data, then diving deeper on the subset with the most room for progress.
Note that many of the diagnoses above have a direct and obvious response. For example, if there’s too little training data, then just get more training data! We still find it useful to mentally separate the analysis stage and selection stage (below) since it is easy to slip into trying random approaches without really digging into the underlying issues. Further, diligently returning to error analysis with an open mind often reveals useful insights that will improve your decisions about what to do.
Examples

At Insight for example, when AI Fellow Jack Kwok was building a segmentation system to help with disaster recovery, he noticed that while his segmentation model performed well on his training set of satellite imagery, it performed poorly on the development set, which contained cities that were flooded by hurricanes. The reason was that the hurricane images were of lower quality and blurrier than the training data. Adding an extra augmentation step to the training pipeline, that applied blurring to images helped reduce the gap between training and development performance.
For speech recognition systems, an in-depth error analysis on the development set may reveal that speakers with strong accents that are very different from the majority of users represents a disproportionate number of errors. One could then check the training set to see whether similar accents are well-represented, correctly labeled, and successfully fit by the training algorithm. Underrepresentation or mis-labeling of some user groups is one example of bias in machine learning. For Google’s speech systems, one solution was to actively solicit additional training data from users with strong accents.

Select Approach
Find the simplest way to address the bottleneck
After your analysis, you will have a good sense of what kind of errors your model is making and what factors are holding back performance. For a given diagnosis, there might be several potential solutions and the next step is to enumerate and prioritize them.
Some of the diagnoses above lead directly to potential solutions. For example, if your optimizer appears to be mis-tuned, you could try different step sizes, or consider switching optimization algorithms altogether. If the training dataset is too small, gathering more training data might be a reasonably quick and easy solution.
We suggest that ML engineers and their teams enumerate as many ideas that might work, and then bias toward simple, fast solutions. If an existing solution might work (e.g., using another optimization algorithm already implemented in your toolkit), start with that. While more sophisticated approaches might look like they will get more done in one swing, we often find that improvements from many quick iterations swamps the gains from tinkering with state-of-art or bespoke solutions that take longer to get right. If you have the choice between labeling 1000 data points or researching a cutting edge unsupervised learning method, we think you should collect and label the data. If you could get started with some simple heuristic features, go for it.
Improvements from many quick iterations swamps the gains from tinkering with state-of-art or bespoke solutions that take longer to get right
Tips
Depending on your diagnosis, here are a number of common sets of solutions.
If you need to tune the optimizer to better fit the data:
- For numerical optimizers, try adjusting the learning rate or momentum settings. Starting with a small momentum (0.5) is usually easiest to get working.
- Try different initialization strategies, or start from a pre-trained model.
- Try a type of model that is easier to tune. In deep learning, residual networks or networks with batch normalization may be simpler to train.
If the model is unable to fit the training data well:
- Use a larger or more expressive model class. For example, when using decision trees you could make the trees deeper.
- Check the examples the model gets wrong on the training set for labeling errors, missing fields, etc. Investing time in training data cleanup can improve results significantly.
If the model isn’t generalizing to the development set:
- Add more training data. Note that it may be important to focus on adding training examples similar to classes of errors seen in the development set.
- Augment your data with novel samples generated from real training examples. For example, if you notice your tree detector consistently performs poorly on foggy images, play with OpenCV to add an augmentation step that makes your images look a bit foggy.
- Search over a wider or finer-grained range of hyper-parameters to ensure you find the model that performs best on the development set.
- Try a different form of regularization (such as weight decay, dropout for neural networks, or pruning for decision trees).
- Try a different model class. A different type of model can alter how well you fit your data and how well it generalizes, so it is difficult to know when this will work. One advantage of deep learning is that there is a wide range of “building block” neural network components you can easily try out. If you’re using a traditional model (such as a decision tree or gaussian mixture model), switching model classes is much more involved. If the assumptions embodied by the new model are more correct, the change might help — but it may be better to try easier things first.
Implement
Build only what you need to build, and do it fast
You know what to try, and you’ve made it simple for yourself, now it’s just a matter of implementing… “just”. The goal of this phase is to prototyperapidly so that you can measure the results, learn from them, and go back around the cycle quickly. For that reason, we recommend focusing on building just what’s needed for your current experiment. Note that while your goal is to learn quickly rather than polish everything, your work still needs to be correct and so you should check that the code works as expected frequently.
Tips
Most people overestimate the cost associated with gathering and labeling data, and underestimate the hardship of solving problems in a data starved environment.
When gathering and labeling data:
- Regularly look at your data. Look at the raw data, look at it after it is pre-processed, look at the labels. We can’t stress this enough! You can catch many errors just by keeping an eye on your data at each step of your pipeline. Every session, Insight AI Fellows catch bugs related to data cleaning, bounding box coordinates, and segmentation masks when solving computer vision problems.
- Labeling and cleaning data is a common task. Most people overestimate the cost associated with gathering and labeling data, and underestimate the hardship of solving problems in a data starved environment. Once you get in a rhythm, you can easily label 20 images per minute for classification. Would you rather spend an hour labeling images, and an hour to solve an easy classification problem with a dataset of 1200 images, or spend 3 weeks trying to get a model to learn from 5 examples?
When you code up a new model, start from a similar existing implementation. Many research papers now have freely available code — so try to get code before reimplementing an idea from a paper as there are often undocumented details. This will save you hours/days of work. If possible, for any problem, we recommend going through these successive steps:
- Find an implementation of a model solving a similar problem.
- Reproduce the implementation locally in the conditions of the existing model (same dataset and hyperparameters).
- Slowly tweak the implementation of the model and the data pipeline to match your needs.
- Rewrite any parts needed.
Write tests to check whether your gradients, tensor values, and input data and labels are properly formatted. Do this as you are setting up your model initially, that way if you catch an error once, you will never have to deal with it again.
Measure
Print out your test results and any other metrics (e.g., production constraints) you need to decide whether you’re ready to ship.
If your performance improved somewhat, you might be on the right track. In this case, now might be a good time to clean up any components you know are working well and make sure that the experiment can be reproduced by others in your team.
On the other hand, if performance became worse or didn’t improve enough, you’ll need to decide whether to try again (going back to the analysis phase) or to abandon your current idea. These decisions are easier to make if each cycle of the ML Loop is relatively cheap: you haven’t put too much energy into making your code perfect, and another attempt won’t take too long — — so you can decide what to do based on the risk and value of the idea instead of sunk cost.
Tips
- Useful performance metrics include accuracy and loss for the ML side, and business value metrics (how often do we recommend the right article amongst our top 5?) Remember that the latter metrics are what matters in the end, since they are the ones determining the usefulness of what you are building. If your test metric (as optimized by your ML code) is diverging from your business metric, the end of this measurement cycle is a good time to stop and consider changing your optimization criterion or test set.
- Since you’ll print out your metrics at the end of each development loop regardless, it’s often a convenient place to compute other metrics as well that will help you during the analysis phase or help decide whether to continue with the current idea at all.
- You’ll often end up building a “dashboard” with your test metric and business metrics as well as other useful data that you can see at the end of every experiment. This is especially useful when working in teams.
Optimizing the Loop
The ML Engineering Loop above will help you make methodical progress toward a better model despite the inherent uncertainty of the task. It is not at all magical, unfortunately — you will need to develop your ability to make good choices in each stage, like identifying the performance bottleneck, deciding which solutions to try, how to implement them correctly, and how to measure performance for your application. You will also need to become adept at iterating quickly. Thus, you should also take time to think about improving the quality and speed of iteration so that you can make maximum progress during each cycle and you can finish many iterations quickly.
Tips
- If your analysis stage is slowing you down, create a script that summarizes the results of an experiment, collects errors from the training and dev sets, and formats them nicely. This “dashboard” of often-used diagnostic outputs can help you overcome that moment of thinking “Ugh! I have to run that analysis by hand again… I’ll just try this random solution instead.”
- If you feel like you’re hand-wringing about what to try, just pick one.Trying to do too many things at once slows you down. You can sometimes come back to try another idea while your experiment is running!
- Collecting data is a common way to get better performance. If getting a lot more data sounds painful, but would really make a difference, it might make sense to invest in tools to make data easier to collect, clean and label.
- If you’re feeling stuck on diagnosing the bottleneck or selecting a good model to try next, consider reaching out to experts. Domain experts can often provide useful insights during error analysis (e.g., pointing out subtle distinctions that make some cases hard or easy), while research papers or experienced ML practitioners might have creative solutions to add to your list of things to try (and will be better able to help you if you can share your detailed analysis so far).
- Good implementation skills are important, and coding hygiene can prevent bugs. That said, since a large fraction of ideas will fail, feel free to hack your experiment code with abandon and throw away failed code while you’re in the process of iterating. Once you feel comfortable that you’ve made useful progress, you can impose some discipline and clean up before the next loop.
- If your experiments are taking too long, consider spending some time looking for optimizations to your code. Or talk to a systems expert about ways to make your training faster. When in doubt, buying an upgraded GPU or running more experiments in parallel is a time-honored solution to the “hurry up and wait” problem of ML experimentation.
As with other decisions, only work on these items if they’ll address a current pain point. Some teams spend too much time building the “perfect” framework only to discover that the real headaches are somewhere else.
Conclusion
ML projects are inherently uncertain and the approach we recommend above is designed to provide you a handrail as a guide. While it’s hard to hold yourself accountable to hitting a specific accuracy goal when the fate of your experiment is uncertain, you can at least hold yourself accountable to finish that error analysis, draw up a list of ideas, code them, and see how it works. In both Emmanuel’s and Adam’s experience, resisting the call of the shiny things, and relentlessly focusing on incremental progress can lead to extraordinary results in both research and application. This has transformed teams, and allowed countless Fellows to deliver on cutting-edge projects.