Credit Risk Modeling Using Machine Learning Approach (Part 1)
In this post, we will demonstrate a machine learning approach for modeling credit risk in the peer-to-peer (P2P) lending domain. This is a two-part series of credit risk modeling. In this part, we will discuss the basics of credit risk modeling, about P2P lending platform, the dataset used and, exploratory data analysis.
APPLICATION OF MACHINE LEARNING IN CREDIT RISK MODELING
Credit risk modeling is a technique used by creditors for identifying the level of credit risk linked with the borrowers. Now, the question comes
WHAT IS CREDIT RISK EXACTLY?
Credit risk is the amount of risk that arises when an individual or corporate borrower unable or fails to pay their debts in time. It means that the creditor who extended the debt to the borrower will not be able to receive the principal and interest associated with the debt. This will create an imbalance in the cash flow as principal and interest are the basic rewards on which creditor runs their business. So, a higher level of credit risk can affect the creditor adversely by increasing collection costs and disrupting the consistency of cash flows.
ABOUT P2P LENDING PLATFORM
In P2P lending, loans are typically uncollateralized i.e., without physical security against loans and lenders seek higher returns as compensation for the financial risk they take. In addition, they need to make decisions under information asymmetry that works in favor of the borrowers. In order to make rational decisions, lenders want to minimize the risk of default of each lending decision and realize the return that compensates for the risk. The overview of the P2P lending framework is shown in below figure 1.
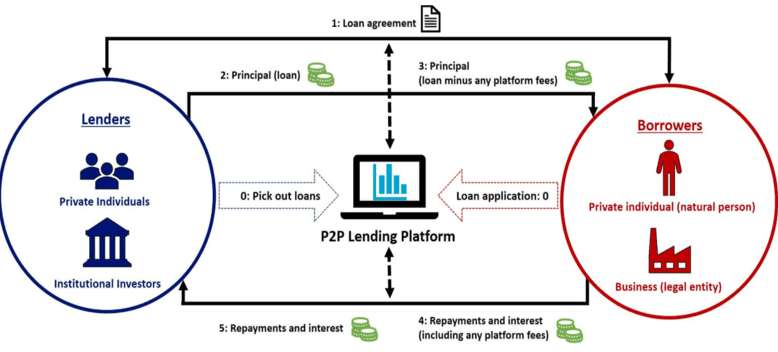
Fig. 1 Overview of Peer-to-peer lending framework (Source: p2pmarketdata.com)
MACHINE LEARNING PIPELINE
In this project, our machine learning pipeline consists of the following steps namely data understanding, data extraction, data pre-processing, data normalization, feature engineering, model building, splitting of the dataset, 10-fold cross-validation, model evaluation, and validation, deriving critical features and model deployment.
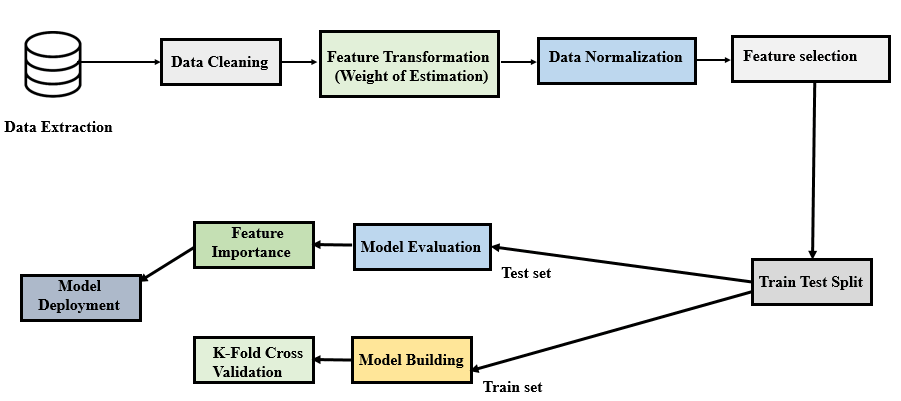
Fig. 2 The architecture of machine learning pipeline
ABOUT DATASET
The dataset used in this study has been retrieved from a publicly available data set of a leading European P2P lending platform Bandora. The retrieved data is a pool of both defaulted and non-defaulted loans from the time period between 1st March 2009 and 27th January 2020. The data comprises demographic, financial information of borrowers and loan transactions features. The dataset can be accessed from here.
The original dataset consists of 134529 borrowers with 112 features. The distribution of loan status in the dataset is shown below Fig.3 :
| Status | # Number of Instances |
|---|---|
| Repaid | 31622 |
| Late | 45772 |
| Current | 57135 |
| Total | 134529 |
Fig.3 Distribution of loan status in the dataset
For this study, we have selected only repaid and late status loans as we don’t know much about current status loans which are still operational. Further after removing invalid records from the dataset, we are come up with 71782 records consisting of 40175 late status loans (treated as default loans) and 31607 as repaid loans which are fully repaid by borrowers. The description of the features in the dataset along with their data type is shown below Table 1.
|
Name |
Data Type | Description |
|
Age |
Numeric |
Borrower’s age in years |
|
Gender |
Nominal | Borrower’s gender |
|
Country |
Nominal | The country in which the borrower resides |
|
Language code |
Nominal |
Native Language of the borrower |
| Education | Ordinal |
The level of education of borrower |
| Marital Status | Nominal | Marital status of borrower |
| Employment Status | Nominal | Employment status of the borrower |
| Occupation Area | Nominal | Occupation of borrower i.e., in which sector borrower works |
| Home Ownership Type | Nominal | Home ownership status of borrower |
| Income Total | Numeric | Borrower’s total monthly income |
| Applied Amount | Numeric | The Loan amount applied by borrower |
| Amount | Numeric | Amount of Loan sanctioned |
| Loan Duration | Numeric | Current duration of loan in months |
| Interest | Numeric | Maximum interest rate applied in the loan application |
| Monthly Payment | Numeric | Estimated amount the borrower has to pay every month |
| Use of Loan | Nominal | Actual purpose for which loan was taken by borrower |
| Rating | Ordinal | Bondora Rating issued by the Rating model |
| CreditScoreEsMicroL | Ordinal | A score that is specifically designed for risk classifying subprime borrowers. |
| Debt To Income | Numeric | Ratio of borrower’s monthly gross income that goes toward paying loans |
| Existing Liabilities | Numeric | Borrower’s number of existing liabilities |
| Liabilities Total | Numeric | Total monthly liabilities of borrower |
| Refinance Liabilities | Numeric | The total amount of liabilities of borrower after refinancing |
| No. Of Previous Loans Before Loans | Numeric | Number of previous loans of borrower |
| Amount of Previous Loans Before Loans | Numeric | Value of previous loans of borrower |
| Previous Repayments before loan | Numeric | How much the borrower had repaid previous loans prior to this loan |
| Previous early repayment count before loan | Numeric | Number of times borrower repaid the loan early |
| Free Cash | Numeric | Discretionary income of borrower after monthly liabilities |
| Bids Portfolio Manager | Numeric | The amount of investment offers made by Portfolio Managers |
| Bids Api | Numeric | The amount of investment offers made via Api |
| Bids Manual | Numeric | The amount of investment offers made manually |
| New Credit Customer | Nominal | Did the customer have prior credit history in Bondora. |
| Verification Type | Nominal | Method used for loan application data verification |
| Monthly Payment Day | Numeric | The day of the month the loan payments are scheduled for |
| Interest and Penalty Payments Made | Numeric | Interest and penalty payments made by borrower so far |
| Employment Duration Current Employer | Ordinal | Employment time of borrower with the current employer |
| Default | Binary |
Default status of borrower. 0: Loan Repaid 1: Loan Default |
Table 1. The description of dataset features
DATA CLEANING
In this step, we at first simply remove those features from the dataset which are not relevant for prediction of credit risk such as Loan ID, Loan Number, Listed on UTC, Username, Bidding Started on, etc., and after that, we removed those features which have more than 40% missing values. After removal of those features, we were left with 35 features only as shown in Table 1 and the features which have less than 40% missing values were imputed with median values as median values were more representative in comparison to mean values.
EXPLORATORY DATA ANALYSIS (EDA)
In this step, we have analyzed different features of the dataset by performing exploratory data analysis.

Fig. 4 Distribution of Default Loans
As per the above figure 4, the majority of loans in the dataset are default loans, which will help in analyzing the pattern of default loans.

Fig. 5 Age and Gender distribution of defaulters
From the above figure, it is evident that the average age of defaulters is around 40 years, whereas males have the highest number of default loans in comparison to females and undefined gender. From below Fig. 6, we can observe that the secondary level of education has the highest number of defaulters, and borrowers who didn’t specify their employment status have the highest number of default loans.
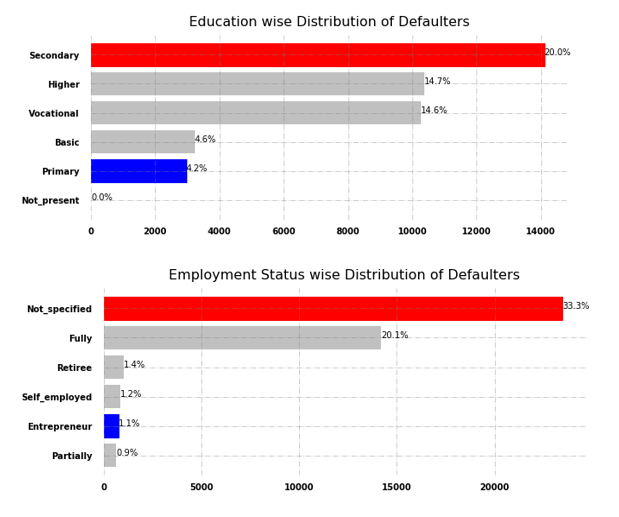
Fig. 6 Education and Employment status wise distribution of defaulters
From Fig. 7, we easily see that borrowers who didn’t specify their gender have the highest number of default loans i.e., 33.3%, and Estonian, Finnish, and Spanish-speaking borrowers defaulted most which is but obvious as this peer-to-peer lending platform is basically targeted to European countries.
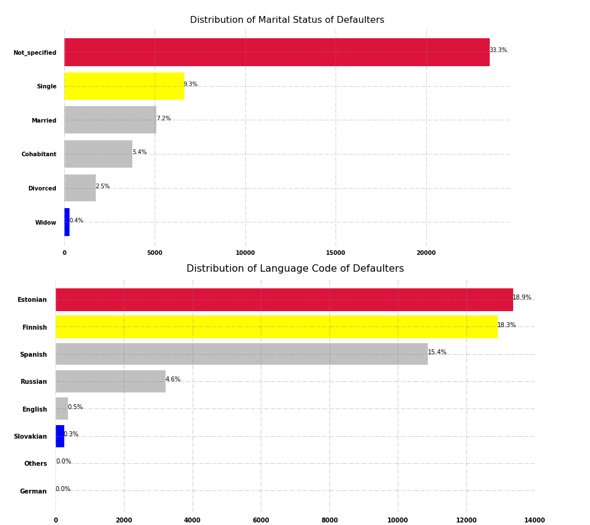
Fig. 7 Distribution of marital status and language of defaulters
In Fig. 8, we can observe that those loans having no clear purpose defaulted most, while others and home improvement purpose are second and third most defaulted loans.
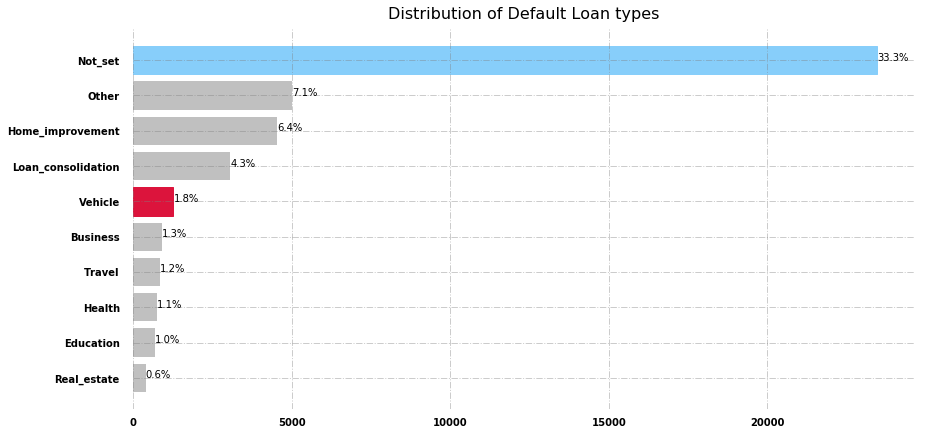
Fig. 8 Distribution of purpose of loan in case of default loans
Most defaulters are those who have employment of more than 5 years while the second most defaulted loans come from the borrowers who have employment up to 1 year. That’s really surprising that most experienced professionals defaulted the most.
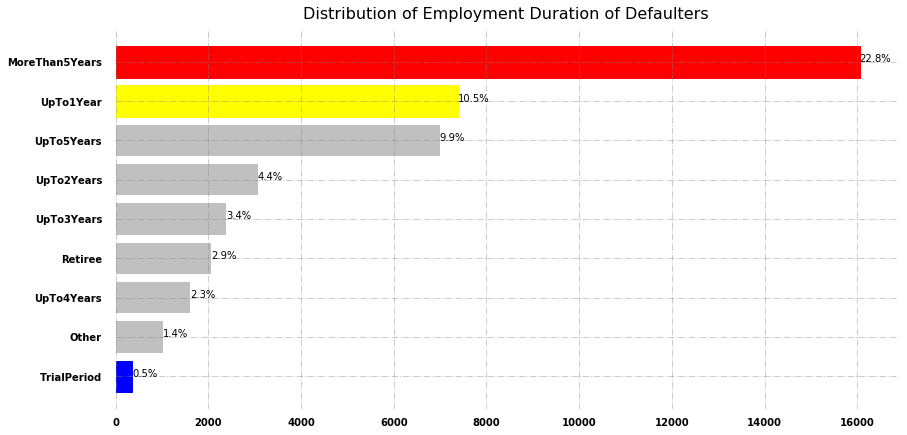
Fig.9 Distribution of employment duration of defaulters
In the next part, we will demonstrate the data pre-processing, feature engineering, modeling, performance analysis of different models and discuss the business objective achieved using the best model.


